 b
b
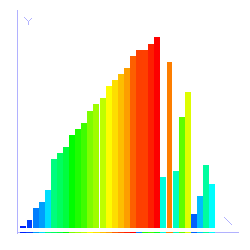
This view is superb for understanding the dynamics of many sorting algorithms, especially when the algorithm runs on small amounts of data. However, this view does not provide any history of the execution. We see the current state only. However, if we consider the sticks as being drawn in the xy plane, we can see an execution history by drawing the sticks at increasing values of z as the algorithm progresses. That is, we stack the new row of sticks in front of the old ones. This results in a 3D solid.
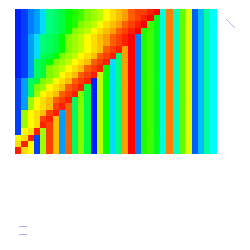
In order to emphasize the importance of the current row of sticks, we chose to flatten all previous sticks and to encode by color the value of the corresponding array element. In addition, we keep the current row fixed at z=0, and move the stack of flattened sticks forward at each step. This results in a horizontal plane of "paint chips" giving a complete history of the algorithm. (Another way to think of the "chips" view is as the sticks stamping their color onto the chips plane, which is pulled forward as execution progresses.)
Fig. b shows the same scene as in Fig. a, but viewed from above. Fig. c shows the same scene again, but viewed from an oblique viewing perspective. Notice how we can see both the current contents of the array and the history of the algorithm's execution in the 3D view.
Fig. d uses the same view and viewing angle to display Shakersort. In the BALSA system, the chips view was a separate view of sorting algorithms, one among a dozen or so views. The chips view of Shakersort was instrumental in providing the insight that led to Janet Incerpi's Ph.D. thesis on the worst-case analysis of Shellsort (Brown University, 1985). The insight suggested by the picture of Shakersort is the "zipper" effect: in one left-to-right pass, many elements are moved one position to the left, only to be moved back to their previous position on the subsequent right-to-left pass.
This digression is important because the 3D visualization technique of stacking a 2D view along the z axis as the algorithm progresses is general purpose, and can be applied to many 2D views. It is reasonable to imagine that other hidden properties of algorithms will be exposed by examining 3D history of 2D views.