| Figure 1 |
 |
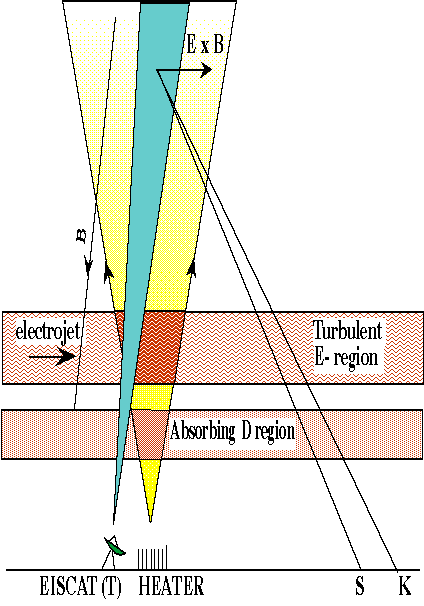
Figure 1 is a schematic representation of the heating experiment carried out in February 1995. The heater wave is turned on during a period of large current flow (electrojet intensification) in the ionosphere. The EISCAT UHF radar is employed to investigate the strength of the current, and the fluctuations in electron temperature caused by the heater wave.
| Figure 1 |
 |
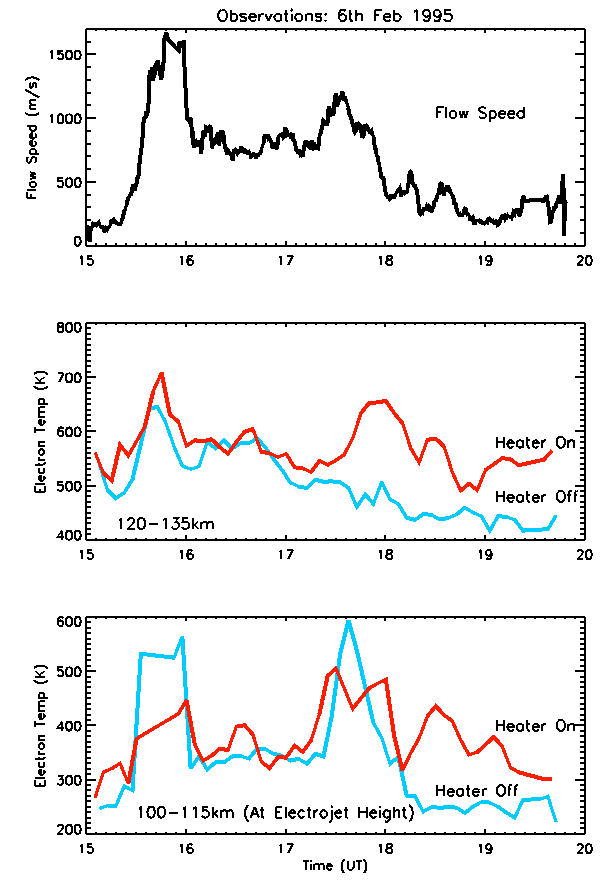
Figure 2 displays the results produced during a heating experiment at EISCAT on 6 February 1995. The top panel presents the flow speed of the ionospheric plama, which indicates the strength of the current. The middle panel presents the electron temperature above the current region (120-135 km). The blue line represents the natural electron temperature when the heater is switched off, and the red line indicates the increased temperature when the heater is switched on. The bottom panel indicates the electron temperatures in the current region (100-115 km). During periods of high current flow, just before 16:00 and just before 18:00, turbulence causes the natural electron temperature to rise. Under these conditions, turning on the heater actually produces a reduction in electron temperature, since it switches off the turbulence through nonlinear interactions.
| Figure 2 |
 |
