 |
 |
|
| Home |
About the Project |
Tagging |
Habitat |
Fishes of Great Bay |
Teachers |
Kids |
Adopt A Fish |
Glossary |
Related Links |
Tracking Summer Flounder in an Estuary Creek: A WebQuest for 5-8th Grade (Biology)
This lesson is designed after an actual study that was conducted in the area known today as the Jacques Cousteau National Estuarine Research Reserve (JCNERR) in southern New Jersey by S.T. Szedlmayer and K.W. Able during August and September of 1990. The scientists tagged and tracked Age-0 (less than one year old) summer flounder, Paralichthys dentatus in Schooner Creek, which runs adjacent to the field station, for about one month to help determine how long these young juveniles lived in the creek and where they went while they utilized the creek environment as their nursery. This lesson introduces students to marine field work using a tagging/telemetry method. First they have to do some research, and the links are provided. The actual data obtained in the field is put into easy to read charts. The students get to study the data and draw conclusions about the juvenile flounder in the study. A map is also available for them to fill in while reading the tasks. The scenario given to the students makes them the young scientists and allows them to use the information obtained to make recommendations regarding the protection of this habitat in a reserve system (which, of course did happen in 1997).
Field studies are necessary to acquire the information needed to understand what is happening in nature. Tagging and tracking is a common method used to understand fish behavior and habitat use. This lesson was created to enhance the 5-8th graders awareness of the dynamics of habitat use. Computer skills are utilized using the Internet, excel spreadsheets, and a word processor. Some metric measurements and mapping skills will be used enhancing the map. New vocabulary words will be discovered enriching the student's language skills. Marine biology and fish are interesting and fun to study. The students will learn how estuaries contain essential habitats for the growth of juvenile marine organisms. It is important that the students learn some key vocabulary and concepts before beginning. The words are listed on their worksheet and highlighted throughout the lesson.
National Science Standards Addressed (Grades 5-8)Content A -- Understandings about Scientific InquiryDevelop the skills of investigation and the understanding that scientific inquiry is guided by knowledge, observations, ideas and questions. Technology used to gather data enhances accuracy and allows scientists to analyze and quantify results of investigations. Content C -- Regulation and BehaviorAll organisms must be able to obtain and use resources, grow, reproduce, and maintain stable internal conditions while living in a constantly changing external environment. Content G -- Nature of ScienceScientists formulated and test their explanations of nature using observation, experiments, and theoretical and mathematical models.
The lesson begins with some research that needs to be done on the Internet. Links are provided. The tasks have "The Questions" woven into them. A work sheet is provided with just "The Questions" and vocabulary terms as an organizational aid to the students. An answer sheet is also provided to aid the instructor. (Additional terms are also defined in the glossary section of this website.) But please be open to some of the possibilities the students come up with and not use the answer sheet as the final word.
A detailed map is provided above for you, the teacher, while an incomplete version is given to the students to complete. Spreadsheets contain the data. It is explained to the teacher in the answer sheet. Students organize their research and data into a three to five page paper. Be sure they read the “Evaluation” section before they begin so they know what is expected of them. The Internet work can probably be completed in two class periods. Perhaps one week after that to complete the paper? Variations:If the students need to pair up on the computers they will answer the questions together and come up with similar conclusions. If time is a factor, you may want to do it this way and have class discussions about the questions and data (especially if the students are not familiar with looking at graphs).
To implement the lesson, you will need:
This lesson may be "stand alone" or it may be preceded by the Fish Tagging and Essential Fish Habitat Lesson. The following Web sites are used in the lesson: Human Resources:One teacher is needed to implement this, but aides or parents are a plus!
The maximum points for this project are 120. There are three sections in the scoring rubric.
This lesson meets national standards in a "hands on" way that is interesting and enlightening. Students get to experience what a tagging and tracking study entails; they get a feel for what scientists do. They get to interpret data and think like a scientist. They gain experience in expressing what they interpreted into a written report. They gain an appreciation for the dynamic salt marsh habitat, how important these places are in nature and how imperative that these places are protected for today and the future.
Szedlmayer, S.T. and Able, K.W. 1993. Ultrasonic Telemetry of Age-0 Summer Flounder, Paralichthys dentatus, Movements in a southern New Jersey Estuary. Copeia, (3), pp. 728-739 Special thanks to: Scott Haag for the map, Lori Chen for professional assistance, and Dr. Ken Able for the inspiration. Last updated on February 6th, 2003. Based on a template from The WebQuest Page
Tracking Summer Flounder in an Estuary Creek Vocabulary and Task QuestionsSome words and concepts the students should be familiar with before they begin:
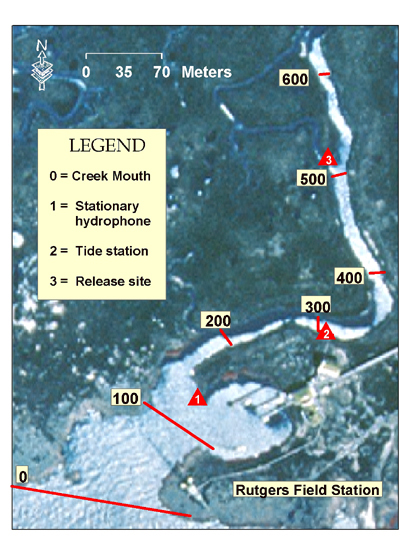
Task one: The JCNERRQ: Why are estuaries so important? Hint: Look at the plants, animals, history of the area, geography, geology. You may want to visit another estuary site for general information. It never hurts to get additional information, and you may impress the teacher. A: 1) land buffer against storms, 2) major stop for migrating birds (70,000 individuals in the winter), 3) habitat for young fish and nesting grounds for birds. Q: What is unique about this estuary? Hint: Take a look at the Mullica-Great Bay Watershed and the whole reserve. A: The Reserve offers a wide range of different habitats, including: upland pine-oak forests, lowland Atlantic white cedar swamps, freshwater marshes, salt and freshwater tidal marshes, barrier islands (including sandy beaches and dune habitats), shallow bays, and the coastal ocean.” Since the estuary is part of a reserve, the area up stream is pretty much undeveloped. Thus, the whole river system is relatively pristine. Estuaries in other states are not so fortunate. Q: Visit this site a little longer to read about and see all of the components in the reserve. How does one affect another? A: The Mullica River and its tributaries travel through the forests and swamps before emptying into the bay. Anything that happens to the water in the upper reaches of the system will affect the lower reaches. Task Two: Research of Paralichthys dentatusQ: What parts of the estuary do summer flounder frequent and why? A: Adults usually prefer hard sandy substrate where they can burrow; can exploit a broad range of lower and mid-estuary habitats including salt marsh creeks and seagrass beds, which usually have muddy or silty substrates, as well as sand flats. Occurs in bays, lagoons and shallow coastal waters. Q: What ways are flounder prepared and consumed by humans? Have you ever eaten flounder? A: Utilized fresh and frozen; can be steamed, fried, boiled, microwaved and baked and of course Sushi! Q: What are two adaptations this order of fish has made to the environment? A: Their bodies are highly compressed. Eye Migration (the right eye moves around to the left side of the head during the larval stage causing the fish to be flat.) Their eyes can protrude above body surface allowing fish to see when buried in the substrate. Adults almost always do not have a swim bladder, allowing them to stay on the bottom. Q: What are some challenges in this environment? A: Students need to think about this one. Living on the bottom can be dangerous because of fishermen’s nets. Also, bottom dwellers are exposed to the sediments that may contain toxins washed into the ocean from the rain or from the land. Sometimes, their food supply may be limited. Task Three: The method, the data and the mapQ: Why did they only tag nine fish? A: Tagging studies are very time consuming. A small study sample is necessary to keep track of all the tagged fish without needing an army out there looking for them. Q: Was the creek a large enough study area? A: Yes, once again, a small area can be handled by one or two technicians or scientists. Q: What are some challenges in choosing this tagging and tracking method? A: The ultrasonic tags are very expensive. Setting up the study area and the hydrophones in a way that catches all the movements of the fish. Fishermen may catch and keep a tagged fish. Time and patience are essential. Q: When did they track using the portable method? Why? A: They tracked the fish in kayaks. Initial detection was recorded on a detailed map of the creek. Then the creek was searched every six hours during slack water. Slack water is the time just before a high or low tide when the current is minimal. Q: Where was the stationary hydrophone and what direction was it pointing? A: The stationary hydrophone was placed approximately 150 meters from the creek mouth on a point of land near the boat basin. (see map) It was pointing out toward the map and was good for detecting about 130 meters in front of it. Q: What is "missing time?" A: A "missing" category accounted for the time it was known the fish was in the creek but could not specifically locate it. For example, if a particular fish was located at the mouth at 6:00 am and in the upper creek at 12:00 pm, but did not detect it moving up the creek, 6 hours were placed in the "missing" category. Q: What is a refractometer? A: An instrument used to measure salinity by measuring the indices of refraction in the water. Build a map. The students have a map with only the creek mouth marked. Have them use the legend to fill in every 100 meters up to 600m, the stationary hydrophone, the tide station and the release site. All of this can be found in the lesson. Task Four: Analyze the data and draw conclusionsQ: What information does the data provide? A: 1) The total time each fish spent in each of the three locations and time missing. 2) Movement of the fish between high and low tides 3) Mean water temperature, salinity and dissolved oxygen. Q: Where did the fish spend most of their time and why? A: Look at the graph "Total time in each location." The student can see that the mouth was the most preferred location. Why? The mouth area served as a low-energy holding area because its physical configuration probably produced a low current area during both flood and ebb tides. Q: What do you think happened to fish A, C, F and H? A: Looking at "Total time in each location" and "Movement" graphs, the students can see that the data for A, C, F, H is very limited. This is because these fish left the creek quickly after being released. This rapid exit may have been caused by the stress associated with capture, handling, and transmitter attachment. Q: What does "mean" DO, Temperature and Salinity tell us? A: Mean means average. Have the students look at these with and without fish A, C, F, and H. Compare each fish with the average.
Q: What property/properties of water would cause the fish to move? A: Water temperatures and dissolved oxygen concentrations in the creek on several instances were well outside the average values and may have affected fish movements. These factors along with high and low tides caused the fish to move (energy conservation). The fish move up the creek during high tide and down the creek during low tide. (Movement graph) By late September, cool autumn temperatures in the creek ultimately caused the flounder to move out to the shelf where the water is temperature is warmer and more consistent. Task Five: List reasons to protectQ: What steps can we take as responsible stewards on planet Earth to be sure that this habitat is healthy and available to future generations of fishes? A: Scientific data is important to present to decision makers in our community, state or nation. With more and more people on the planet, natural areas like estuaries may be considered for shopping malls and parking lots. Or take a look at Atlantic City. Encourage your students to dig deep, get passionate and understand that they are responsible for the future of our planet and it begins in their own communities. |
| Copyright © 2005 Rutgers University |