Average
From Wikipedia, the free encyclopedia
|
|
This article needs additional citations for verification. Please help improve this article by adding reliable references. Unsourced material may be challenged and removed. (September 2008) |
In mathematics, an average, or central tendency [1] of a data set refers to a measure of the "middle" or "expected" value of the data set. There are many different descriptive statistics that can be chosen as a measurement of the central tendency of the data items.
An average is a single value that is meant to typify a list of values. If all the numbers in the list are the same, then this number should be used. If the numbers are not all the same, an easy way to get a representative value from a list is to randomly pick any number from the list. However, the word 'average' is usually reserved for more sophisticated methods that are generally found to be more useful.
The most common method is the arithmetic mean. There are many other types of averages, such as median (used most often to describe house prices and incomes). [2]The average is calculated by combining the measurements related to a set and to compute a number as being the average of the set.
Contents |
[edit] Calculation
[edit] Arithmetic mean
Simply put, if n numbers are given, each number denoted by ai, where  , the arithmetic mean is the sum of the ai's divided by n or
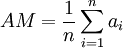 .
.
The arithmetic mean, often simply called the mean, of two numbers, such as 2 and 8, is obtained by finding a value A such that 2 + 8 = A + A. It is then simple to find that A = (2 + 8)/2 = 5. Switching the order of 2 and 8 to read 8 and 2 does not change the resulting value obtained for A. The mean 5 is not less than the minimum 2 nor greater than the maximum 8. If we increase the number of terms in the list for which we want an average, we get, for example, that the arithmetic mean of 2, 8, and 11 is found by solving for the value of A in the equation 2 + 8 + 11 = A + A + A. It is simple to find that A = (2 + 8 + 11)/3 = 7.
Again, changing the order of the three members of the list does not change the result: A = (8 + 11 + 2)/3 = 7, and that 7 is between 2 and 11. This summation method is easily generalized for lists with any number of elements. However, the mean of a list of integers is not necessarily an integer. "The average family has 1.7 children" is a jarring way of making a statement that is more appropriately expressed by "the average number of children in the collection of families examined is 1.7".
[edit] Geometric mean
Geometric mean of a1,a2,...,an is defined as
![GM=\sqrt[n]{\prod_{i=1}^n a_i}=\sqrt[n]{a_1 a_2 ... a_n}](http://web.archive.org/web/20081218120609im_/http://upload.wikimedia.org/math/9/7/a/97aa4b742101f89ab8487f7a5d7db82d.png)
Geometric mean can be thought of as the antilog of the arithmetic mean of the logs of the numbers.
Example: Geometric mean of 2 and 8 is 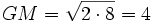 .
.
[edit] Harmonic mean
Harmonic mean for a set of numbers a1,a2,...,an is defined as the reciprocal of the arithmetic mean of the reciprocals of ai's:
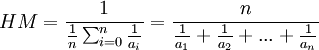
One example where it is useful is calculating the average speed. For example, if the speed for going from point A to B was 60km/h, and the speed for returning from B to A was 40km/h, then the average speed is given by  .
.
[edit] Inequality Concerning AM, GM & HM
A well known inequality concerning Arithmetic, Geometric, and Harmonic means for any set of positive numbers is

It is easy to remember noting that the alphabetical order of the letters A, G and H is preserved in the inequality.
[edit] Mode and median
The most frequently occurring number in a list of numbers is called the mode. The mode of the list (1, 2, 2, 3, 3, 3, 4) is 3. The mode is not necessarily well defined, the list (1, 2, 2, 3, 3, 5) has the two modes 2 and 3. The mode can be subsumed under the general method of defining averages by understanding it as taking the list and setting each member of the list equal to the most common value in the list if there is a most common value. This list is then equated to the resulting list with all values replaced by the same value. Since they are already all the same, this does not require any change.
To find the median, order the list according to its elements' magnitude and then repeatedly remove the pair consisting of the highest and lowest values until either one or two values are left. If exactly one value is left, it is the median; if two values, the median is the arithmetic mean of these two. This method takes the list 1, 7, 3, 13 and orders it to read 1, 3, 7, 13. Then the 1 and 13 are removed to obtain the list 3, 7. Since there are two elements in this remaining list, the median is their arithmetic mean, (3 + 7)/2 = 5.
[edit] Annualized return
The annualized return is a type of average used in finance. For example, if there are two years in which the return in the first year is −10% and the return in the second year is +60%, then the annualized return, R, can be obtained by solving the equation: (1 − 10%) × (1 + 60%) = (1 − 0.1) × (1 + 0.6) = (1 + R) × (1 + R). The value of R that makes this equation true is 0.2, or 20%. Note that changing the order to find the annualized returns of +60% and −10% gives the same result as the annualized returns of −10% and +60%.
This method can be generalized to examples in which the periods are not all of one-year duration. Annualization of a set of returns is a variation on the geometric average that provides the intensive property of a return per year corresponding to a list of returns. For example, consider a period of a half of a year for which the return is −23% and a period of two and one half years for which the return is +13%. The annualized return for the combined period is the single year return, R, that is the solution of the following equation: (1 − 0.23)0.5 × (1 + 0.13)2.5 = (1 + R)0.5+2.5, giving an annualized return R of 0.0600 or 6.00%.
[edit] Types
The table of mathematical symbols explains the symbols used below.
| Name | Equation or description |
|---|---|
| Arithmetic mean |  |
| Median | The middle value that separates the higher half from the lower half of the data set |
| Geometric median | A rotation invariant extension of the median for points in Rn |
| Mode | The most frequent value in the data set |
| Geometric mean | ![\bigg(\prod_{i=1}^n x_i \bigg)^{1/n} = \sqrt[n]{x_1 \cdot x_2 \dotsb x_n}](http://web.archive.org/web/20081218120609im_/http://upload.wikimedia.org/math/9/5/9/959bd28f4e139005be03eb73ab4e06b5.png) |
| Harmonic mean |  |
| Quadratic mean (or RMS) |
 |
| Generalized mean | ![\sqrt[p]{\frac{1}{n} \cdot \sum_{i=1}^n x_{i}^p}](http://web.archive.org/web/20081218120609im_/http://upload.wikimedia.org/math/f/d/d/fdd1519e14d60cd83ffcf2749181ccde.png) |
| Weighted mean |  |
| Truncated mean | The arithmetic mean of data values after a certain number or proportion of the highest and lowest data values have been discarded |
| Interquartile mean | A special case of the truncated mean, using the interquartile range |
| Midrange |  |
| Winsorized mean | Similar to the truncated mean, but, rather than deleting the extreme values, they are set equal to the largest and smallest values that remain |
| Annualization |  |
[edit] Solutions to variational problems
Several measures of central tendency can be characterized as solving a variational problem, in the sense of the calculus of variations, namely minimizing variation from the center. That is, given a measure of statistical dispersion, one asks for a measure of central tendency that minimizes variation: such that variation from the center is minimal among all choices of center. In a quip, "dispersion precedes location". In the sense of Lp spaces, the correspondence is:
| Lp | dispersion | central tendency |
|---|---|---|
| L1 | average absolute deviation | median |
| L2 | standard deviation | mean |
 |
maximum deviation | midrange |
Thus standard deviation about the mean is lower than standard deviation about any other point; the uniqueness of this characterization of mean and midrange follows from convex optimization, as the L2 and norms are convex functions. Note that the median in this sense is not in general unique, and in fact any point between the two central points of a discrete distribution minimizes average absolute deviation.
Similarly, the mode minimizes qualitative variation.[citation needed]
[edit] Miscellaneous types
Other more sophisticated averages are: trimean, trimedian, and normalized mean. These are usually more representative of the whole data set.[citation needed]
One can create one's own average metric using generalized f-mean:

where f is any invertible function. The harmonic mean is an example of this using f(x) = 1/x, and the geometric mean is another, using f(x) = log x. Another example, expmean (exponential mean) is a mean using the function f(x) = ex, and it is inherently biased towards the higher values. However, this method for generating means is not general enough to capture all averages. A more general method for defining an average, y, takes any function of a list g(x1, x2, ..., xn), which is symmetric under permutation of the members of the list, and equates it to the same function with the value of the average replacing each member of the list: g(x1, x2, ..., xn) = g(y, y, ..., y). This most general definition still captures the important property of all averages that the average of a list of identical elements is that element itself. The function g(x1, x2, ..., xn) =x1+x2+ ...+ xn provides the arithmetic mean. The function g(x1, x2, ..., xn) =x1·x2· ...· xn provides the geometric mean. The function g(x1, x2, ..., xn) =x1−1+x2−1+ ...+ xn−1 provides the harmonic mean. (See John Bibby (1974) “Axiomatisations of the average and a further generalisation of monotonic sequences,” Glasgow Mathematical Journal, vol. 15, pp. 63–65.)
[edit] In data streams
The concept of an average can be applied to a stream of data as well as a bounded set, the goal being to find a value about which recent data is in some way clustered. The stream may be distributed in time, as in samples taken by some data acquisition system from which we want to remove noise, or in space, as in pixels in an image from which we want to extract some property. An easy-to-understand and widely used application of average to a stream is the simple moving average in which we compute the arithmetic mean of the most recent N data items in the stream. To advance one position in the stream, we add 1/N times the new data item and subtract 1/N times the data item N places back in the stream.
[edit] Etymology
The original meaning of the word average is "damage sustained at sea": the same word is found in Arabic as awar, in Italian as avaria and in French as avarie. Hence an average adjuster is a person who assesses an insurable loss.
Marine damage is either particular average, which is borne only by the owner of the damaged property, or general average, where the owner can claim a proportional contribution from all the parties to the marine venture. The type of calculations used in adjusting general average gave rise to the use of "average" to mean "arithmetic mean".
[edit] Footnotes
- ^ In statistics, the term central tendency is used in some fields of empirical research to refer to what statisticians sometimes call "location".
- ^ An axiomatic approach to averages is provided by John Bibby (1974) “Axiomatisations of the average and a further generalization of monotonic sequences,” Glasgow Mathematical Journal, vol. 15, pp. 63–65.
[edit] References
- Hardy, G.H.; Littlewood, J.E.; Pólya, G. (1988), Inequalities (2nd ed.), Cambridge University Press, ISBN 978-0521358804
[edit] See also
[edit] External links
| Look up Average in Wiktionary, the free dictionary. |

