Profiles of cities and towns within the East of England region
Luton | Bedford | Peterborough | Cambridge | Ipswich | Norwich | Milton Keynes
See also
- East of England
- Profiles of ethnic groups
- Go back to the map page
- Diversity and Integration home pages
Key to the ethnicity table on this page
This local area: |
|
National average: |
Ethnic profiles, by region
Did you find this page useful?
Page information
This page was last updated on 24 November 2006
Ethnicity profiles
East of England
Overall, in terms of its ethnic diversity, the East of England region falls slightly below the average for the country as a whole.
At a glance...
Out of every 1,000 people, on average:
- 914 are White British
- 37 are White non-British
- 23 are Asian
- 11 are of mixed race
- 9 are Black
- 4 are Chinese
In 2001, 6.1% of people living in the East Midlands were born abroad, up from 5.1% in 1991.
Source: Office for National Statistics, BBC
Only one ethnic group - White British, at 91% - is represented here at a proportion greater than the national average, and its share of Asian residents is among the lowest of the nine English regions.
According to the 2001 census, the East of England is home to 5.4 million people, ranking it fourth on the list of England's most populous regions.
Geographically speaking, it is the second largest English region, covering an area of 19,120 square kilometres. It has a population density of 282 people per square kilometre.
- Profile of the East of England region, including data on population, health, housing and employment (Office for National Statistics website)
The region does, however, include one large town - Luton - that is remarkable for its ethnic diversity. With less than two-thirds (64%) of its population coming from the White British group, it ranks behind only London, Leicester and Slough on the Office for National Statistics' ethnic diversity index. It is home to more than a quarter of all Asian people living in the region, despite accounting for just 3% of the region's total population.
Population by ethnic group
East of England
Population: 5,388,140
| Ethnic group/sub-group | Population | Proportion compared to national average | |
| White | 5,125,003 | ||
| British | 4,927,343 | ||
| Irish | 61,208 | ||
| Other | 136,452 | ||
| Mixed | 57,984 | ||
| White and Black Caribbean | 19,882 | ||
| White and Black African | 6,109 | ||
| White and Asian | 17,385 | ||
| Other mixed | 14,608 | ||
| Asian | 121,752 | ||
| Indian | 51,035 | ||
| Pakistani | 38,790 | ||
| Bangladeshi | 18,503 | ||
| Other Asian | 13,424 | ||
| Black | 48,464 | ||
| Caribbean | 26,199 | ||
| African | 16,968 | ||
| Other Black | 5,297 | ||
| Chinese | 20,385 | ||
| Other ethnic group | 14,552 | ||
Source: Census 2001, Office for National Statistics
Asians are not, however, the largest ethnic minority group in the region. That distinction goes to the White Other group, which, at 136,000 people, accounts for 2.5% of the population of the East of England.
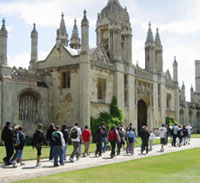
Cambridge's world-famous university attracts students from all over the world. In 2005, people from outside the UK made up one in six of its intake of 3,500 first-year students.
There are three significant reasons for this. The first is the large number of US- and German-born military personnel serving in the area - nearly 65,000 American and German citizens lived in the area at the time of the 2001 census, the vast majority of whom would have described themselves as being of White Other ethnic origin. Second, the region attracts a large number of overseas students, as it contains some of Britain's largest universities, including Cambridge, where people from the White Other group make up nearly 10% of all residents. Third, this region has been one of the leading destinations for non-EU European migrants, due to the ready availability of work within its large agricultural sector; even in 2001, before EU expansion brought still greater numbers of migrant workers to the area, some parts, such as West Thurrock, saw their proportions of foreign-born residents double compared to ten years previously.
Although the proportion of black people living in the region is less than 1%, this is still one of the highest concentrations of this ethnic group outside London and the West Midlands. Of the 48,000 black people living here, about 60% are of Caribbean origin. Nearly a quarter live in Luton, and about 10% in Milton Keynes. The latter town is, incidentally, remarkable for the fact that is mirrors almost perfectly the ethnic make-up of England as a whole across all sixteen Census 2001 categories.
Take a closer look
Click on the links below to find out more about the ethnic make-up of individual cities and towns within the East Midlands region.
Luton | Bedford | Peterborough | Cambridge | Ipswich | Norwich | Milton Keynes