Profiles of London boroughs
Barking & Dagenham | Barnet | Bexley | Brent | Bromley | Camden | City of London | City of Westminster | Croydon | Ealing | Enfield | Greenwich | Hackney | Hammersmith & Fulham | Haringey | Harrow | Havering | Hillingdon | Hounslow | Islington | Kensington & Chelsea | Kingston-upon-Thames | Lambeth | Lewisham | Merton | Newham | Redbridge | Richmond | Southwark | Sutton | Tower Hamlets | Waltham Forest | Wandsworth
See also
Key to the ethnicity table on this page
This local area: |
|
National average: |
Ethnic profiles, by region
Did you find this page useful?
Page information
This page was last updated on 18 July 2007
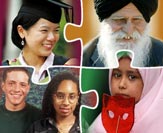
Ethnicity profiles
London
The London region is, by some distance, the most ethnically diverse in Britain. People from ethnic minority groups made up 40% of its population at the time of the 2001 census.
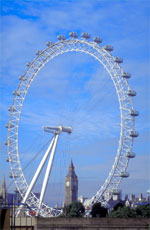
Greater London is the metropolitan area which includes the City of London and the 32 London boroughs. The average population of each borough is around 250,000.
The region has a population of over 7.1 million and covers an area of 1,579 square kilometres. The population density is 4,761 people per square kilometres, more than ten times greater than that of any other English region.
- Profile of the London region, including data on population, health, housing and employment (Office for National Statistics website)
At a glance...
Out of every 1,000 people, on average:
- 597 are White British
- 120 are Asian
- 114 are White non-British
- 109 are Black
- 32 are of mixed race
- 11 are Chinese
In 2001, 25% of people living in Greater London were born abroad, up from 19% in 1991.
Source: Office for National Statistics, BBC
All but one of the top 25 local authorities in the Office for National Statistics' 'league table' of ethnic diversity were London boroughs. Only nine of the 32 boroughs were considered less than 'highly diverse' (that is, a less then 50 per cent chance that two people chosen at random will belong to the same ethnic group.
Within Greater London, more than 50 ethnic groups are represented in numbers of 10,000 or more. Nearly three-quarters of England's total Black African population live in London, as do six out of ten Black Caribbeans, half the Bangladeshi population, one in four Indians, a third each of England's White Irish, Mixed, and Chinese populations, and one in five Pakistanis.
Population by ethnic group
London
Population: 7,172,091
| Ethnic group/sub-group | Population | Proportion compared to national average | |
| White | 5,103,203 | ||
| British | 4,287,861 | ||
| Irish | 220,488 | ||
| Other | 594,854 | ||
| Mixed | 226,111 | ||
| White and Black Caribbean | 70,928 | ||
| White and Black African | 34,182 | ||
| White and Asian | 59,984 | ||
| Other mixed | 61,057 | ||
| Asian | 866,693 | ||
| Indian | 436,993 | ||
| Pakistani | 142,749 | ||
| Bangladeshi | 153,893 | ||
| Other Asian | 133,058 | ||
| Black | 782,849 | ||
| Caribbean | 343,567 | ||
| African | 378,933 | ||
| Other Black | 60,349 | ||
| Chinese | 80,201 | ||
| Other ethnic group | 113,034 | ||
Source: Census 2001, Office for National Statistics
A constantly evolving city
There is, however, a marked difference in concentrations of people from ethnic minorities between inner London and outer London - in the former, a little over half of all residents are white and of British ethnic origin, but for the latter the proportion rises to two-thirds.
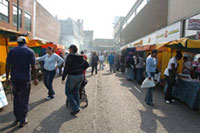
St John's Road, Wembley, in the London borough of Brent - Britain's most diverse local authority. Only 44% of all the people living here ticked the 'White British' box in the 2001 census.
London's ethnic make-up is constantly evolving. For centuries, the city has been the first destination for most people migrating to Britain. Today, the fastest growing ethnic minority groups in London are no longer Asian and Carribean people; over the last decade, white Europeans and African people have formed the majority of new arrivals. According to the 2001 census, the number of black people of African origin living in London has, for the first time, overtaken that of people of Caribbean descent.
Foreign-born people living in London in 2001
73,000 South Africans | 69,000 Nigerians | 66,000 Kenyans (mostly Kenyan Asians) | 50,000 Sri Lankans | 46,000 Cypriots | 45,000 Americans | 41,000 Australians | 39,000 Turks | 38,000 French | 40,000 Germans | 39,000 Italians | 34,000 Somalis | 27,000 Zimbabweans | 27,000 New Zealanders | 25,000 Yugoslavs | 22,000 Portuguese | 22,000 Spaniards | 20,000 Iranians
Source: Beyond Black and White, Institute for Public Policy Research 2005
Take a closer look
Click on the links below to find out more about the ethnic make-up of individual London boroughs.
Barking & Dagenham | Barnet | Bexley | Brent | Bromley | Camden | City of London | City of Westminster | Croydon | Ealing | Enfield | Greenwich | Hackney | Hammersmith & Fulham | Haringey | Harrow | Havering | Hillingdon | Hounslow | Islington | Kensington & Chelsea | Kingston-upon-Thames | Lambeth | Lewisham | Merton | Newham | Redbridge | Richmond | Southwark | Sutton | Tower Hamlets | Waltham Forest | Wandsworth