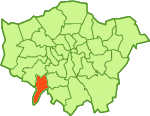
London Borough of Kingston upon Thames
Profiles of London boroughs
Barking & Dagenham | Barnet | Bexley | Brent | Bromley | Camden | City of London | City of Westminster | Croydon | Ealing | Enfield | Greenwich | Hackney | Hammersmith & Fulham | Haringey | Harrow | Havering | Hillingdon | Hounslow | Islington | Kensington & Chelsea | Kingston-upon-Thames | Lambeth | Lewisham | Merton | Newham | Redbridge | Richmond | Southwark | Sutton | Tower Hamlets | Waltham Forest | Wandsworth
See also
Key to the ethnicity table on this page
This local area: |
|
National average: |
Did you find this page useful?
Page information
This page was last updated on 14 November 2006
Ethnicity profiles: London
Kingston upon Thames
Includes: Berrylands, Chessington, Coombe, Kingston upon Thames, Kingston Vale, Malden Rushett, Motspur Park, New Malden, Norbiton, Old Malden, Surbiton, Tolworth
By London's standards, Kingston upon Thames is one of the 'whiter' boroughs in the city, although many of its main population centres are often thought of as part of Surrey, rather than Greater London.
More than 75% of Kingston residents are White British, and the white group as a whole makes up 85% of the population.
The borough has lower-than-average proportions of Asian people compared to the city as a whole(8%, or 11,000 people) and especially black people (less than 2%, or 2,000 people, which is also lower than the average for the whole of England).
New Malden is thought to have the largest expatriate community of South Koreans in Europe. There are no official figures, but some estimates put the Korean population in this town as high as 5,000.
- Profile of the Kingston upon Thames local authority area, including data on population, health, housing and employment (Office for National Statistics website)
Kingston upon Thames
Population: 147,273
| Ethnic group/sub-group | Population | Proportion compared to national average | |
| White | 124,392 | ||
| British | 111,810 | ||
| Irish | 3,201 | ||
| Other | 9,381 | ||
| Mixed | 3,357 | ||
| White and Black Caribbean | 591 | ||
| White and Black African | 392 | ||
| White and Asian | 1,398 | ||
| Other mixed | 976 | ||
| Asian | 11,466 | ||
| Indian | 5,322 | ||
| Pakistani | 1,916 | ||
| Bangladeshi | 384 | ||
| Other Asian | 3,844 | ||
| Black | 2,309 | ||
| Caribbean | 772 | ||
| African | 1,406 | ||
| Other Black | 131 | ||
| Chinese | 2,026 | ||
| Other ethnic group | 3,723 | ||
Source: Census 2001, Office for National Statistics

