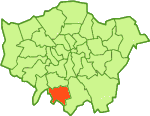
London Borough of Sutton
Profiles of London boroughs
Barking & Dagenham | Barnet | Bexley | Brent | Bromley | Camden | City of London | City of Westminster | Croydon | Ealing | Enfield | Greenwich | Hackney | Hammersmith & Fulham | Haringey | Harrow | Havering | Hillingdon | Hounslow | Islington | Kensington & Chelsea | Kingston-upon-Thames | Lambeth | Lewisham | Merton | Newham | Redbridge | Richmond | Southwark | Sutton | Tower Hamlets | Waltham Forest | Wandsworth
See also
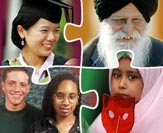
Key to the ethnicity table on this page
This local area: |
|
National average: |
Did you find this page useful?
Page information
This page was last updated on 25 November 2006
Ethnicity profiles: London
Sutton
Includes: Beddington, Belmont, Benhilton, Carshalton, Cheam, Hackbridge, Little Woodcote, North Cheam, Rosehill, St. Helier, Sutton, Wallington, Worcester Park
Sutton, which forms one of the most southerly parts of Greater London, is the second least ethnically diverse borough in London, according to the Office for National Statistics.
It is extremely close to the national average in terms of its population of almost all ethnic groups, from the proportions of its White British population (84%, against 87% nationally), to its Black (2.6% versus 2.3%) and Asian populations (4.7% against 4.6%)
People from the Other White group make up 3.4% of Sutton's residents. This is slightly higher than the national average, but less than that of London as a whole (8.3%). This group, of some 6,500 people, forms the largest ethnic minority in the borough.
- Profile of the Sutton local authority area, including data on population, health, housing and employment (Office for National Statistics website)
Sutton
Population: 179,768
| Ethnic group/sub-group | Population | Proportion compared to national average | |
| White | 160,351 | ||
| British | 150,515 | ||
| Irish | 3,664 | ||
| Other | 6,172 | ||
| Mixed | 3,725 | ||
| White and Black Caribbean | 1,205 | ||
| White and Black African | 358 | ||
| White and Asian | 1,274 | ||
| Other mixed | 888 | ||
| Asian | 8,500 | ||
| Indian | 4,133 | ||
| Pakistani | 1,216 | ||
| Bangladeshi | 578 | ||
| Other Asian | 2,573 | ||
| Black | 4,601 | ||
| Caribbean | 2,054 | ||
| African | 2,208 | ||
| Other Black | 339 | ||
| Chinese | 1,211 | ||
| Other ethnic group | 1,380 | ||
Source: Census 2001, Office for National Statistics